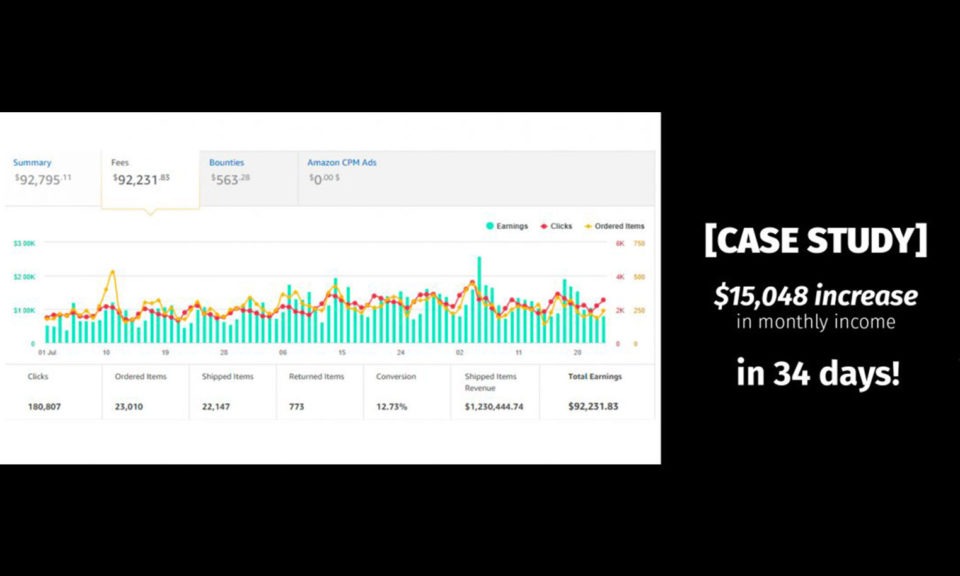
[CASE STUDY] – How we Generated an Extra $15,048 in Monthly Revenue in 34 Days
The headline sounds like click bait right?
It got your attention. That is what it was meant to do.
You are about to learn exactly what web optimization techniques we did to increase one of our client’s monthly income by over $15,048.
By the end of this post, you will be able to implement most of what we did too.
Every time I write a post, I say the same thing:
“CRO doesn’t need to be complicated.”
In August we took Robert’s site monthly revenue from $20,403 to $ 35,451 in just over a month.
That is an extra $15,048 for the month of August.
Let me start off by saying: This site is a beast, an absolute beast. It is in fact, the beastiest site I have ever worked on.

Over 200,000 unique views a month.
We didn’t use any tricky plugins and we didn’t even touch any sales copy.
What we did do, was use our methodology that I have talked about many times.
Sure, we did have 4 of the CROguy staff making the changes, managing the tasks and pulling together the reporting and tracking, but whether you have 100,000+ unique views per month or 1,000 views per month, the same system applies.
It just comes down to consistently applying the process.
The Earnings Proof i.e the “Show Me the Money” Screenshot

Amazon is just one of this site’s monetization methods. Like any good business you should always diversify.
How to Get Started.
We have had hundreds of sites apply to work with us over the last 6 months. We have seen everything from lead generation sites for local businesses, multi-million dollar eCommerce brands, micro niche and absolute beast Amazon affiliate sites.
One thing that has helped us get these results so quickly is that we get to see websites in a bunch of different industries across a huge amount of niches. This variety of experience has allowed us to develop tried-and-tested systems and know what works very quickly, allowing us to get quick results for our clients every time.
It all goes back to something else I say frequently.
Find the 20% of the areas of your website that are getting 80% of the clicks and generating roughly 80% of the revenue. This of course isn’t fixed in stone, the ratios are not going to match up perfectly. However, it is a great way to systematically process a large batch of websites and get consistent results. Sometimes it’s 90/10 sometimes it is 95/5. Regardless, there are always certain areas that you can use to scale up the revenue of a website with relative ease.

See more about the 80/20 principle here.
Now, let’s use a very general type of buyer intent keyword for this example.
In order to keep Robert’s identity confidential, we are going to use a generic keyword “best dog trimmers” as the example.
When someone types in “best” in front of the keyword in Google, they’re typically looking for the best of something to buy for themselves. They know the solution to their problems, they are trying to figure out what is the best one to buy.
For some people, they already know what they want, for others they are still browsing.
Either way, a good review of that product can be the tipping point that convinces the user to make a buying decision, gets them to pull out their credit card and make a purchase from your affiliate partners site.
This is not a post on keyword research and how to write converting copy, Matt Diggity has done one of those recently.
This is a post on how we helped Robert increase revenue on his site by $15,048 for the month of August.
Not in one year, but in just one month.

How we found the 80/20 for Robert.
We used heat maps to figure out where the users were clicking. Heat maps were also tracking what call to actions got the audience’s attention and made them click over to Robert’s affiliate partner, only one of which was Amazon.
Pro Tip: Don’t just rely on one affiliate partner. See what other affiliate programs are available for the products or keywords you are ranking for. Don’t just rely on amazon if you can, they regularly ban partners without warning or any clear reason. Have a google around, there are often other programs available. It’s all about not having all your eggs in one basket.
To see how to to set up and read heat maps, I have done an in-depth tutorial here.
We run the heat maps for around 1000 views and it will show us where the action is. Once we have that data, we can start implementing the changes.

There are certain things we do every time after we review the heat maps.
Do you want a 20-100% conversion rate increase?
Check How the Site Shows Up on Mobile.
This seems like common sense, but a lot of people still don’t focus on mobile when optimizing for conversions. The majority of your users, especially in the B2C (business to consumer) market, coming to your website will either be mobile or will be in the coming years. Mobile will increase in importance and you need to keep that in mind with every website you build and plan to monetize. You can find out more about CRO coaching if you plan on monetizing your site like a beast.
Are the Call to Actions Buttons or Text?
We have to remember, we have pretty fat fingers. If your call to action is text only that is linked, sometimes we can’t click the link easily. Use nice big buttons for your call to actions. You can make them easily here.
Notice how I mentioned fat fingers? Mobile is becoming more important. People are now tapping on a link with their fingers rather than clicking with a mouse. Make it easy for them. A good conversion rule of thumb to follow is to make the entire sales process as frictionless as possible.
>> CLICK HERE TO BUY THIS PRODUCT <<

Use a Comparison Table.
Most people are already looking to buy the best product listed on your review page. Don’t make it hard for them. While a 1,000 word+ review is great from an SEO perspective, it is not super valuable from a CRO perspective. If you were looking to buy the best dog hair trimmers, are you more likely to a read 5,000 in depth detailed buyer guide or more likely to skim through the entire content to see the conclusion the article came to as to which trimmer to buy?
While having that 5,000 word buyer guide is awesome, you need to format it to accommodate these people skimming for the answer. You do this by adding a comparison table.
A Comparison table lets people see the bare bones statistics compared against each other. Also, these tables are visually pleasing and give your site a feeling of authority on the subject.
Make sure this comparison table can be used on mobile and is viewed correctly on these devices. Tables are somewhat notorious for showing up bad on mobile. You can also seek help from our conversion specialist anytime you need one.
Now, when all these changes are made to your website, reset the heatmaps for all pages and let the data gather for 1000+ views.

Doubling Down on Revenue
The next step makes a lot of sense but rarely happens in reality. This step is also used mostly in a series of conversion case study and testing.
The quickest way to grow your revenue once the 80/20 has been rolled out is to make the changes and let them gather data for a week or two.
Then we do an export of all the revenue generated and work out the 80/20 for where the sales came from.
Nearly every time I do this on a clients site, 80% of the revenue will come from just a handful of products.
→ Export all your revenue into a spreadsheet. Make sure you have each product that you have sold listed, with total revenue for each.
→ Divide the revenue of each product by the total revenue generated.
→ Group the 20% of items that total roughly 80% of the revenue.
→ Move those products to a new list.
→ The New List is Where the Gold is
Now let’s go back to our heat maps and make a list of all the places that we have call to actions or links to the shortlist we have compiled.
Testing Further – The Icing on the Cake.
This is where we get the biggest increases.
Not only have we doubled down on where the action is on our website, but we have also doubled down on where all the revenue is coming from.
These are the areas we split test to get super quick results.
If you don’t know how to set up your own split testing campaigns, I have done a tutorial here. It is far easier than you think.
I am putting together a tutorial on the 80/20 of split testing soon, so keep an eye out for it on the CROGuy blog.
Whenever you do a test, change just one thing at first on your site. If you do a ton of changes at once, you won’t ever be able to know what caused the uptick or downtick in revenue. Once you’ve made the changes, get at least a 1,000 views to that change to see if there are any noticeable differences.
Here are a few things you can test your shortlist with:
- Changing out button colors
- Changing what the actual text on the buttons say (i.e Click Here for More Info vs. Learn More)
- Your page layouts (does the page convert better if the comparison table is above the fold or below? What other page elements can you test?)
The Results from Client Reporting. 
Closing Thoughts.
As you can see, the process behind how we increased Robert’s website from $20,403 to $35,451 in just over a month isn’t complicated. You have to however have a clear process, be patient and roll out the changes step by step while tracking them.
This is just one of the conversion rate optimization case studies of many sites we have rolled this process on. Since I was originally an SEO before getting into CRO, I’m extremely process driven. We have (and continue to do so) processed dozens of high earning sites using our processes. Every site refines our process.
If you follow the simple checklist I’ve talked about above, you can see some easy wins for your website.
These changes can be the difference between an extra $500 per month, or in Rob’s case it could be an extra six-figures annual income… without ever adding a single article, back link or increasing his traffic.
When you put it that way, is it really so tedious to change a few elements around to claim the cash you’re leaving on the table?
I didn’t think so.
Kurt Philip



 To get started, please enter your details below
0 Comments