Short answer

Conversion rate optimization (CRO) is the process of increasing the percentage of website visitors who complete a goal, such as a purchase, a lead form or a trial signup. It finds where and why visitors leave, changes the page to remove the cause and measures the result, so you get more from traffic you already have.

  • Conversion rate is conversions divided by visitors, times 100; keep the same base, sessions or users, in every comparison.
  • Judge a change by the macro conversion, such as an order or a lead, and use micro conversions to find the step that loses people.
  • A good conversion rate is one that beats your own last period on the same traffic, not an industry average.
  • The process runs in six steps: goals and tracking, research, hypotheses, prioritization, testing, then analysis before starting again.
  • CRO cannot fix a product people do not want; it works best when the offer is sound and the page is the problem.

What is conversion rate optimization?

Conversion rate optimization (CRO) is the process of increasing the percentage of website visitors who complete a goal, such as a purchase, a lead form or a trial signup. It works by finding where and why visitors leave without acting, changing the page to remove the cause, and measuring the result, usually with an A/B test.

CRO is also called conversion optimization, website conversion optimization or, in British spelling, conversion rate optimisation. Whatever the name, the job is the same: get more value from the visitors you already have, instead of paying for more of them. It applies to any site with a goal: online stores, lead generation sites, SaaS products, affiliate and content sites.

Good CRO is research first. It is not a list of tricks, a redesign on a hunch, or changing button colors until something sticks. It starts with evidence about what real visitors do and say, and it ends with a measured result you can trust.

What counts as a conversion?

A conversion is any action on your website that you count as success. A macro conversion is the main goal of the page or site, such as an order or a lead. A micro conversion is a smaller step that leads toward it, such as adding to cart, starting a form or watching a demo. Track both, but judge changes by the macro conversion.

Macro and micro conversions by type of site
Type of siteMacro conversionMicro conversions
eCommerceCompleted orderProduct view, add to cart, start checkout, account creation, email signup
Lead generationSubmitted lead or booked callForm started, calculator used, pricing page viewed, phone number clicked
SaaSTrial or paid signupPricing page viewed, demo watched, feature page visited, plan selected
Affiliate or review siteClick to a merchant that leads to a saleComparison table viewed, review read to the end, product link clicked
Content or mediaSubscription or membershipNewsletter signup, second article read, free account created

Micro conversions are useful for diagnosis: they show which step loses people. But a change that lifts add to cart clicks and leaves orders flat has not helped, so the final decision rests on the macro conversion, and ideally on revenue. Read more about micro conversions.

How do you calculate conversion rate?

Conversion rate is the number of conversions divided by the number of visitors in the same period, multiplied by 100. If 2,000 sessions produce 50 orders, the conversion rate is 50 / 2,000 x 100 = 2.5%. Choose sessions or users as the base and keep it the same in every comparison.

Conversion rate = conversions / visitors x 100

Sessions or users?

Use sessions when one person can convert many times, such as repeat orders on a store. Use users when each person can convert only once, such as a free trial or a quote request. Google Analytics 4 reports both, and its default "session key event rate" and "user key event rate" are these two versions.

Conversion rate vs click-through rate

Conversion rate (CVR) measures how many visitors complete the goal. Click-through rate (CTR) measures how many people who saw a link, ad or button clicked it. CTR tells you whether people come in; CVR tells you whether they act once they are there. To measure the first number, use the CTR calculator; to work on it, see how to improve CTR. Revenue per visitor (RPV), which combines conversion rate and order value, is often the best single number for a store.

What is a good conversion rate?

A good conversion rate is one that is higher than your own last period on the same traffic. Industry averages vary widely with the type of conversion, price, traffic source and device, so they make a poor target. A free guide download on a dedicated landing page converts far more often than a high-ticket purchase from a first visit.

That is why questions such as "Is 2.5% good?" or "Is 30% good?" have no single answer. A 30% rate is plausible for an email signup from people who already know you, and would be remarkable for a first-visit purchase of an expensive product. Before you compare against anyone else, compare against yourself:

  • By device. Mobile and desktop usually convert differently. A wide gap points to a mobile problem worth fixing.
  • By traffic source. Email, paid search, organic search and social visitors arrive with different intent.
  • By page and step. The step with the biggest drop is usually where the work pays off.
  • New vs returning visitors. Returning visitors usually convert better; if they do not, ask why.

For context, the largest published landing page benchmark, Unbounce's 2024 Conversion Benchmark Report, puts the median landing page conversion rate at 6.6% across industries, with industry medians from 3.8% to 12.3%. It covers more than 41,000 landing pages, each counting its own goal, so it is context rather than a target.

For more published benchmarks with their sources and sample sizes, see Convertica's conversion rate optimization statistics, which lists only figures traced to the original research.
Why is conversion rate optimization important?

Conversion rate optimization is important because it earns more from traffic you already pay for. Every visitor costs something, in ad spend, content or time. Raising the share who convert lowers what each customer costs you, makes every marketing channel work harder, and shows you what your customers actually want.

  • More revenue from the same traffic. If 10,000 visitors a month convert at 2%, that is 200 orders. At 2.5%, the same visitors bring 250 (an illustrative example, not a forecast). The ROI calculator works out what a lift like that is worth on your own traffic and order value, and how soon it would pay for the work.
  • Lower cost per customer. With the same ad budget, a higher conversion rate means each customer costs less to acquire, which can let you bid more and win more traffic. The CPC calculator shows the most you can pay for a click at a given conversion rate.
  • Better decisions. Testing replaces opinion. A redesign that has been tested is far less risky than one launched on a hunch.
  • Knowledge that compounds. Each research round and test teaches you something about your buyers that carries into ads, emails and product decisions.
  • A better experience. Most fixes remove confusion and friction, which visitors notice whether or not they buy today.

The benefit has limits. CRO cannot fix a product people do not want, a price far out of line with the market, or traffic that was never going to convert. It works best when the offer is sound and visitors are leaving because of the page, not the product.

The conversion rate optimization process in 6 steps

The conversion rate optimization process has six steps: set goals and check your tracking, research where and why visitors leave, write hypotheses, prioritize them, test or implement the changes, and analyze the results before starting again. Each cycle builds on what the last one taught you.

  1. Set goals and check your tracking

    Decide what counts as a conversion for each page type, and which number decides whether a change worked: orders, leads, revenue per visitor. Then compare the conversions in your analytics with the real orders or leads for the same dates. If they do not match, fix the tracking first. Every later step depends on it.

  2. Research where and why visitors leave

    Use numbers to find where people drop out of the funnel, then use observation and conversation to learn why. Analytics shows the leaking step; recordings, heatmaps, polls, surveys and customer interviews show the reason. A careful review of each key page as a first-time visitor, on a phone, adds what the data misses.

  3. Write a hypothesis for each problem

    Turn each finding into a testable statement: "Because we saw [evidence], we believe that [change] will cause [effect] for [visitors], measured by [metric]." A hypothesis that names its evidence and its metric is easy to judge later, whatever the result.

  4. Prioritize what to do first

    Score each hypothesis on its likely impact, the strength of its evidence and how easy it is to build and test. The common models are ICE (impact, confidence, ease) and PIE (potential, importance, ease). Start at the top of the list, and fix obvious breakages straight away without a test.

  5. Test or implement the change

    Where traffic allows, run an A/B test: show the original to half your visitors and the change to the other half, and decide the sample size and run time before you start. Where traffic is too low to test, make the change, watch the numbers closely, and keep a record of what changed and when.

  6. Analyze, learn and repeat

    Read the result against the metric you chose in advance, not whichever one looks best. Check it by device and traffic source. Roll out winners, write down what every test taught you, including the losers, and use it to choose the next hypothesis.

The first two steps are the same work as a CRO audit. Convertica's guide to the CRO audit breaks them into 10 detailed steps, and the full CRO checklist lists what to check on every type of page.

CRO research methods: how to find out why visitors leave

CRO research combines quantitative methods, which show what visitors do and where they leave, with qualitative methods, which show why. Numbers alone tell you a checkout step loses people but not what confuses them. Recordings and surveys alone tell you stories without telling you which ones matter. Use both.

CRO research methods and what each one tells you
MethodTypeWhat it tells youTypical tools
Analytics and funnel reportsQuantitativeWhere visitors come from, which pages and steps lose them, and how each device and source convertsGoogle Analytics 4, your store or CRM reports
Heatmaps and scroll mapsQuantitativeWhere people click, what they ignore and how far down the page they getHeatmap tools
Session recordingsQualitativeHesitation, rage clicks, dead ends and people hunting for missing informationSession recording tools
On-page polls and surveysQualitativeWhat stopped people, in their own words, at the moment it happenedSurvey and poll tools, post-purchase emails
User testingQualitativeWhere real people get stuck when they try to complete a task while thinking aloudRemote user testing services or five recruited customers
Support logs, chat and reviewsQualitativeThe questions and objections people raise before and after buyingHelp desk, live chat, review sites
Form analyticsQuantitativeWhich fields people hesitate on, correct or abandonForm analytics tools
Heuristic reviewExpertClarity, relevance, trust, friction and distraction on each key pageA checklist and a fresh pair of eyes
Speed and technical checksQuantitativeSlow pages, layout shifts, broken elements on certain browsersPageSpeed Insights, real devices

See the guides to heatmap tools and conversion rate optimization tools for what each kind of tool does and how to choose one.

Want the research done for you?

Convertica's free CRO audit app runs on your own page while you watch. Enter your website and email to start: eight checks for people and AI agents, each scored out of 100.

A/B testing and other ways to test a change

An A/B test is the standard way to measure a CRO change: visitors are split at random between the original page (the control) and the changed page (the variant), and the conversion rates are compared once enough visitors have seen each. Random splitting means the only systematic difference between the groups is the change itself.

Ways to test a CRO change
MethodHow it worksUse it when
A/B testRandom split between the original and one changed version of the same pageYou have enough traffic and want to know whether one change works
A/B/n testThe original against two or more variantsYou have plenty of traffic and several distinct ideas for one page
Split URL testVisitors are sent to two different URLs, such as an old and a rebuilt formThe change is a new page or flow, too big to build as a variant
Multivariate testSeveral elements changed at once in every combination, to see which mix works bestYou have very high traffic and want to know how elements interact
Before and afterMake the change for everyone and compare periodsTraffic is too low to test, or the change fixes something clearly broken. Weakest evidence, because seasons and campaigns also change

Three rules keep a test honest. Decide the sample size and run time before you start, using an A/B test sample size calculator. Do not stop the test the moment it looks good. And judge it on the metric you chose in advance, checking the result with a statistical significance calculator. Convertica's complete A/B testing guide covers the whole method.

What if you do not have enough traffic to test?

Then put more weight on research and less on testing. Fix clear problems that recordings, surveys and user tests show many people hitting. Test bigger changes, because large effects need fewer visitors to detect than small ones. Test on the busiest step of the funnel. And measure with before and after comparisons, knowing they are weaker evidence.

Which pages should you optimize first?

Optimize the pages that carry the most traffic and lose the most visitors before the goal. On most sites that is a short list: the top landing pages, the homepage, product or pricing pages, and each step of the checkout or lead form. A small improvement on a busy step is worth more than a big one on a page few people see.

  • Landing pages. Match the promise of the ad or search result, state the offer clearly and keep one main action. See landing page optimization.
  • Homepage. Say what you sell, who it is for and where to go next, without scrolling.
  • Product and pricing pages. Answer the questions people ask before buying, and put proof near the decision.
  • Cart. Show the total cost early and make the next step obvious. See shopping cart optimization.
  • Checkout. Remove surprises, forced accounts and fields you do not need. See checkout optimization.
  • Lead forms. Ask only for what you need now and explain why. See how to reduce form abandonment.

For specific changes to try on each of these pages, with the evidence behind them, see Convertica's conversion rate optimization strategies.

Real results

What CRO looks like in practice

Three Convertica tests, each following the process above: research found the problem, a change was built, and a test measured it. Each figure comes from the original case study, with its metric and timeframe. No result is typical, and none is a promise.

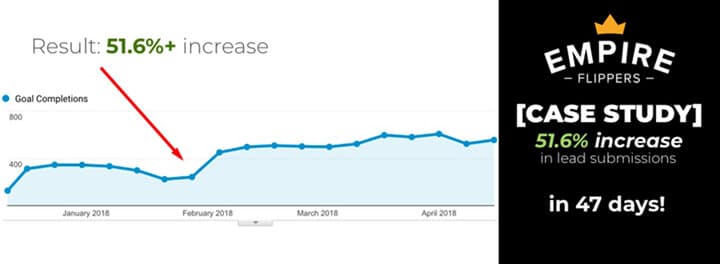
Line chart of goal completions from January to April 2018 that steps up after February, labeled "Result: 51.6%+ increase", beside the Empire Flippers logo and the words "Case study: 51.6% increase in lead submissions in 47 days!"

Lead generation

Empire Flippers: a valuation tool submission process rebuilt

A website marketplace's valuation tool asked for a lot of typed input right after the first click. A rebuilt, step-by-step submission process was split-URL tested, then rolled out.

+51.6%

Conversions (valuation tool submissions), 47 days

Source: Empire Flippers, valuation tool submissions, 47 days, split-URL test then rollout

eCommerce

JustThrive: two sequential split tests on a supplement store

A health supplement store wanted more auto-ship subscriptions and a better return on ad spend. Two split tests ran one after the other, the second against the first winner.

+101.82%

Revenue, cumulative across two sequential split tests, 7 December to 24 March

Source: JustThrive, revenue, two sequential split tests, Dec to Mar

Old handwriting in ink on paper, beside the words "Membership eCommerce Case Study: 49.4% increase".

Membership eCommerce

dScryb: more paid membership sign-ups from search results

A membership store showed locked content in its search results with no clear next step. Adding calls to action and access levels to the results was A/B tested on desktop and mobile.

+49.4%

Paid membership sign-ups, 17-day A/B test

Source: dScryb, paid membership sign-ups, 17-day A/B test, 98% confidence

See all CRO case studies

How is CRO different from SEO?

SEO (search engine optimization) works on getting the right visitors to your site from search. CRO works on what those visitors do once they arrive. SEO is judged by rankings and organic traffic; CRO is judged by conversion rate and revenue per visitor. They share pages, so a change made for one can help or hurt the other.

CRO and SEO compared
SEOCRO
GoalMore qualified visitors from searchMore of those visitors complete the goal
Main measuresRankings, impressions, organic clicksConversion rate, revenue per visitor, leads
Main methodsContent, technical fixes, linksResearch, page changes, A/B tests
Where they meetPage speed, clear structure, content that answers the visitor's question, and mobile usability help both

The practical rule: when you change a page that ranks, keep the content that answers the search, and test the parts that ask for the action. Convertica's guide to SEO vs CRO goes further.

Conversion rate optimization for AI agents

Conversion rate optimization now has a second reader. Visitors increasingly arrive through AI search, and some AI assistants can browse a site and take steps for the person they work for. A page that converts people can still fail an agent if its prices, product details or policies only appear after scripts run, or are locked in images.

This is a new field, and nobody has years of data on it yet, Convertica included. The checks are concrete, though:

  • Product names, prices, stock and shipping terms are in the page HTML, not only drawn by scripts or shown in images
  • Structured data is present and matches what the page shows
  • Return, shipping and guarantee policies are written in plain text that can be quoted
  • The AI crawlers you want are allowed in your robots file and firewall
  • The checkout or lead form can be completed without steps that only a person with a mouse can pass

Agent readiness is one of the eight checks in Convertica's free CRO audit. The CRO audit guide shows what an agent sees on a typical product page, and the guide to how AI agents shop covers the wider shift.

Common conversion rate optimization mistakes

The most common conversion rate optimization mistakes are testing without enough traffic, stopping tests as soon as they look good, copying other sites' "best practices" without evidence, and judging changes by clicks instead of revenue. Each one produces results that look like wins and do not hold up.

  • Trusting broken tracking. If analytics double counts or misses conversions, every decision built on it is wrong.
  • Peeking and stopping early. Early results swing widely. Stop at the sample size you planned, not when the graph looks good.
  • Testing on too little traffic. A test that can never reach a reliable answer wastes weeks. Check first with a sample size calculator.
  • Copying best practices blindly. What worked on another site is a hypothesis for yours, not a rule.
  • Measuring the wrong thing. More clicks on a button is not more revenue. Judge by the macro conversion.
  • Changing everything at once. A full redesign that wins or loses tells you nothing about why.
  • Ignoring mobile. A step that works on desktop is often the one losing people on a phone.
  • Keeping no record. Without a log of tests and results, teams repeat old tests and forget what they learned.
  • Using tricks that cost trust. Fake countdown timers and invented scarcity may lift a number for a while, and can cost returning customers.
  • Treating CRO as a project. Visitors, competitors and traffic sources change. CRO is a cycle, not a one-off fix.

Conversion rate optimization terms and metrics

These are the conversion rate optimization terms you will meet most often, in plain words. Most CRO reports use a handful of them: conversion rate, revenue per visitor, average order value and the statistical terms that decide whether a test result can be trusted.

CRO glossary
TermMeaning
Conversion rate (CVR)Conversions divided by visitors or sessions, as a percentage
Macro conversionThe main goal of a page or site, such as an order or a lead
Micro conversionA smaller step toward the main goal, such as add to cart
Average order value (AOV)Revenue divided by the number of orders
Revenue per visitor (RPV)Revenue divided by visitors; combines conversion rate and order value
Click-through rate (CTR)Clicks divided by the number of people who saw the link, ad or button
Bounce rateIn Google Analytics 4, the share of sessions that were not engaged
FunnelThe sequence of steps from arrival to conversion, and how many people complete each
HypothesisA testable statement of what you will change, what you expect and why
Control and variantThe original version in a test, and the changed version
Sample sizeThe number of visitors each version needs before a test can give a reliable answer
Statistical significanceHow unlikely the observed difference would be if the change had no real effect
Minimum detectable effect (MDE)The smallest lift a test is set up to detect reliably
Lift (uplift)The relative change in a metric between the variant and the control
Heuristic analysisAn expert review of a page against known principles of clarity, trust and friction
CRO auditA structured review that finds where and why visitors leave, and ranks what to fix first

Who does CRO: in-house, a consultant or an agency?

Most businesses start CRO in-house, with a marketer and a developer. A consultant adds direction: someone experienced to run the research, rank the work and read the tests while your team builds the changes. An agency supplies the whole team. The right choice depends on who you already have, and on how much traffic you have to test with.

  • In-house fits when you have people who can research, design and build, and time to learn the method.
  • A CRO consultant fits when you have builders but need experienced direction and someone to keep the testing honest.
  • CRO services from an outside team fit when you need research and planning you do not have in-house.

How to learn conversion rate optimization

Learn CRO by doing it on a real site, in this order: analytics, so you can trust your numbers; research methods, so you can find problems; the basics of test statistics, so you can read results; then copywriting and the psychology of decisions. Keep a written log of every hypothesis and result. Books help with the theory; see Convertica's list of conversion rate optimization books.

How Convertica can help

Convertica has done conversion rate optimization work for 2,000+ clients since 2017, across eCommerce, lead generation, SaaS and affiliate sites. Today it starts with a free CRO audit. The audit is an app that checks your page for people and AI agents: enter your website and email, and watch it run live. After the audit, CRO advisory is led personally by founder Kurt Philip with Convertica's CRO team, and it is priced after your audit. Your team builds the changes; advisory tells you what to change, what to test and how to read the results. If you would rather not build them, full implementation has Convertica's team build the fixes from your audit, also priced after your audit.

Conversion rate optimization FAQ

What is conversion rate optimization in simple terms?

Conversion rate optimization means getting more of the people who already visit your website to do what you want them to do, such as buy, sign up or get in touch. You find out why visitors leave without acting, change the page to fix it, and measure whether the change helped.

What does CRO stand for?

In marketing, CRO stands for conversion rate optimization. The same letters also mean contract research organization in medicine and Chief Revenue Officer in sales, so check the context when you search for CRO.

How do you calculate conversion rate?

Divide the number of conversions by the number of visitors (or sessions) in the same period, then multiply by 100. For example, 50 orders from 2,000 sessions is a 2.5% conversion rate. Use the same definition every time you compare periods or pages.

What is a good conversion rate?

There is no single good conversion rate. It depends on what counts as a conversion, your industry, price, traffic source and device. A free newsletter signup converts far more often than an expensive purchase. The most useful comparison is your own rate over time, split by page, device and traffic source.

What is the difference between CVR and CTR?

Conversion rate (CVR) is the share of visitors who complete a goal, such as a purchase. Click-through rate (CTR) is the share of people who see a link, ad or button and click it. A higher CTR brings more people to a page; a higher CVR means more of them act once they arrive.

Is CRO part of SEO?

No, but they work on the same pages. SEO brings visitors from search; CRO improves what those visitors do once they arrive. Some changes help both, such as faster pages and clearer content, so the two work best when one plan covers both.

How long does conversion rate optimization take?

Fixing clear problems can show results within weeks. A/B tests take longer, because each one must run until it reaches the sample size planned before it started, often two weeks or more. CRO itself has no end date: it is a cycle of research, change and measurement.

Do I need a lot of traffic for CRO?

You need traffic for A/B testing, not for CRO. A low-traffic site can still find and fix clear problems through analytics, recordings, surveys and a careful review. Use an A/B test sample size calculator to see whether your traffic is enough to test a change.

What are the main CRO tools?

Most CRO work uses an analytics tool such as Google Analytics 4, a heatmap and session recording tool, an on-page survey or poll tool, an A/B testing tool and a page speed test. A form analytics tool helps on lead generation sites.

Can I do conversion rate optimization myself?

Yes. Start by checking your tracking, find the page or step where most visitors leave, watch recordings and ask visitors what stopped them, then fix or test one change at a time. Convertica's free CRO audit app can also check a page for you.

Find out what is costing you conversions

Enter your website and email and the audit starts right away. Watch it check your page live: eight checks, each scored out of 100, and three fixes you can make now.